Comprehensive inspection of print quality
First, the characteristics of comprehensive evaluation
When judging the quality of printing using self-checking methods, it often includes people's psychological effects, and therefore there are three problems: First, the evaluation varies from person to person, and the error is large. Second, if it is not the same image, there will be difficulties in evaluation. Third, if it is not the same type of image on the spot, it is not easy to evaluate.
Because it is so difficult to evaluate the print quality by visual inspection, it is necessary to have an objective measurement and evaluation method, and the method of comprehensive evaluation of print quality solves the problems of the above-mentioned visual inspection evaluation.
The comprehensive evaluation method of printing quality has the following three characteristics:
1 First, confirm the existence of the visual inspection value, including the consistency of the impression quality of the printing quality expert and most people.
When discussing the quality measurement evaluation method, the first thing that comes to mind is whether the quality evaluation standards among visual inspections (including printing experts) are the same. If this consistency is small, then the exploration of the evaluation law itself will not make much sense. In this regard, experts in the Japanese printing industry conducted long-term research and experiments and finally came up with a unified view.
Figure 6-22 shows the results of the evaluation of 6 printed samples by 10 general employees and 15 printing machine personnel. Prints with scores close to 6 are good prints. The image is a portrait of a woman.
After a statistical discussion on the evaluation results in Figure 6-22, it was found that the evaluation standards of the personnel involved in the printing machinery were the same, but that of the general employees was inconsistent. The relevant personnel in the printing machinery are composed of different types of workers. Therefore, this result shows that if evaluation is conducted separately for division of labor, there can be uniform evaluation criteria. In other words, the method of determining the score by eye detection is of sufficient value.
2 Based on the objective evaluation method, based on test data.
3 The test data will be calculated and tabled to obtain a comprehensive evaluation score for printing quality.
Second, the comprehensive evaluation of the steps
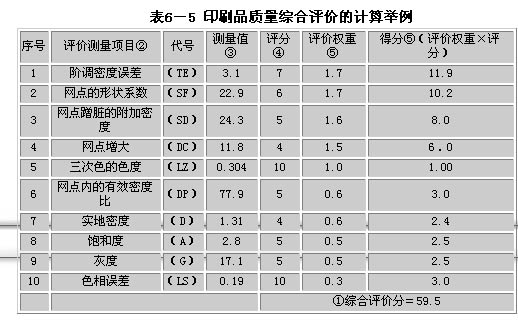
1. Parameter detection and calculation. According to the steps shown in Fig. 6-23, the gradation scales (Y, M, C, and K4 colors) and the color scales printed simultaneously with the images are measured with a densitometer and a dot area densitometer to obtain Table 6 - 5 The values ​​of the 10 evaluation items determined by the instrument.
1 Determine the densities of cyan, magenta, yellow, and blackscale ladders and then plot the print characteristics as shown in Figure 6-24 (see item 2 below for details).
2 Convert the densitometer's color filter to determine the yellow, magenta, cyan, and overprint colors between any two of these three colors - the field density of blue-violet, red, and green standards, as well as yellow, magenta, and cyan Three-color overprinted solid density, and then made a color hexagon as shown in Figure 6-25.
3 Determination of Tonal Density Error (TE): As described in item 2 above, on the printing characteristic curve, the figure faithfully reflecting the combination of white paper density and solid density should be an ideal straight line, and the characteristic curve of the actual printed matter Compared to the ideal straight line, it often becomes an arc-shaped curve that rises upward on the ideal straight line. Therefore, the following formula is used as an evaluation quantity:
Tonal density error TE = ΔA/A × 100% (6-4)
Where: ΔA - the area between the actual printed characteristic curve and the abscissa axis in Figure 6-24;
A—The area between the ideal printing characteristic curve (which is a straight line at a 45° angle to the abscissa axis) and the abscissa axis.
Since the formula (6-4) is obtained from four colors, the average value is taken as the gradation density error of the print (TE=32.5% in Fig. 6-24).
4 Determine the field partial density (D). The average of the four-color field density was used as the evaluation item's on-site density.
5 Determination of saturation (A):
Saturation (A) = actual internal area of ​​hexagonal hexagonal internal area with a saturation of 1.0
6 Determination of Hue Error (LS):
Hue Error (LS) = standard deviation of hexagonal sides/average of hexagonal sides
7 Determine the chroma of the tertiary color (LZ):
Chromaticity of the tertiary color (LZ) = distance/saturation between the hexagonal center and the three-colored overprint (Y+M+C) 1.0 standard hexagonal side length
8 Measurement Gray (G):
Grayscale (G) = 1/6 (LC/HC+LY/HY+LM/HM+LB/HB+LR/HR+LC/HC)
9L denotes the maximum and minimum value of each color density measured by the conversion filter, and the letters added next to it indicate the color: C=cyan, Y=yellow, M=magenta, B=blue-violet, R=red,G = Green.
Measure the shape factor (SF) of the dot: Evaluate the reproducibility of the dot outline. Measure the area of ​​the circular dot and the surrounding length. The shape factor of the dot can be calculated as follows:
SF = (perimeter perimeter) / 4π × (inner area of ​​the dot)
If the dot is round, SF=1.0
Table 6-5 Calculation Example for Comprehensive Evaluation of Print Quality